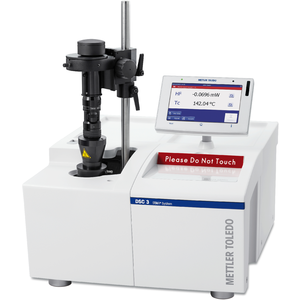
DSC Microscopy Kit - Discontinued Product
Get more information.Microscopy Kit DSC 1
Simultaneous image analysis and DSC
The combination of a DSC and a CCD camera equipped microscope allows a sample to be examined visually while it is heated or cooled.
Devices included in microscopy option
A DSC microscopy system contains a CCD camera with image capture and processing software that is synchronized with the DSC temperature program.
Upgrade possibility
It is possible to upgrade a DSC to a DSC microscopy system within a minute including reflected-light microscopy measurement capability.
Material No.: 51143087

Discontinued since: Aug, 2024
Replaced with: Microscopy Package DSC STAReCapture
DSC Measurements with Visual Observation
DSC Measurements with Visual Observation.
Imaging possibilities
use visual information to aid result interpretation
Intuitive user interface
for simple and easy-to-learn operation
Seamless process
efficient, step-by-step guidance through the visual analysis
Documentation - DSC Microscopy Kit
Accessories - DSC Microscopy Kit
Application Examples - DSC Microscopy Kit
 | | DSC-microscopy analysis of an active pharmaceutical ingredient The melting point is an important characteristic property of a substance. The DSC measurement of an active pharmaceutical substance (API) yielded a curve with two main peaks – an endothermic peak with a maximum at 210.8 °C and an exothermic peak at about 228 °C. A smaller peak was also apparent between these two peaks at about 214 °C. The initial interpretation was that the endothermic peak at 210.8 °C is due to melting. The DSC-microscopy results, however, told a different story. No melting was observed at 211 °C – the first signs were detected at about 214 °C. Clearly, the endothermic DSC peak is not caused by a melting process. The color change of the molten substance leads one to conclude that it decomposes immediately on melting. The small DSC peak observed at about 214 °C is therefore the sum of two simultaneously occurring effects – endothermic melting and exothermic decomposition. Separate TGA-MS measurements showed that the endothermic DSC peak at 210.8 °C is caused by the evaporation of water of crystallization. |
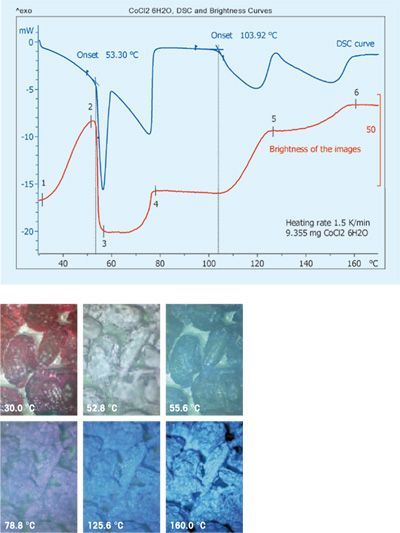
 | Dehydration of CoCl2 hexahydrate The images illustrate the dehydration process of cobalt (II) chloride hexahydrate when it is heated from 30 °C at 1.5 K/min. The initial ruby-red color becomes lighter and lighter until it suddenly changes at about 55 °C. Further color changes are observed between 100 °C and 120 °C and at 160 °C. The differences can be quantified by calculating a curve showing image brightness as a function of temperature. The DSC curve shows a broad endothermic peak up to 80 °C with a sharp peak at about 55 °C superimposed on it. Two further endothermic peaks follow at about 104 and 130 °C. The brightness first increases and then suddenly decreases at about 55 °C. Afterward, it increases again in several steps. The peak at about 55 °C is due to a change in crystalline structure. The images around 55 °C show small droplets of water on the surface of the crystals. This indicates that part of the water of crystallization eliminated from the crystal lattice during the solid- solid transition collects on the surface of the crystals and then evaporates. This is completed by about 80 °C. The two broad endothermic peaks on the DSC curve and the step-like changes in the brightness are due to further loss of water of crystallization. | |
Consumables - DSC Microscopy Kit
Software - DSC Microscopy Kit
Specifications- DSC Microscopy Kit
| Technique | Differential Scanning Calorimetry (DSC) |
| Type | Optical analysis |
| Accessory | Yes |
| Option | No |
